Coefficient plots
What are coefficient plots?
Coefficient plots are a graphical display of the results of a regression analysis. They display the coefficients (as points) along with an indication of the uncertainty of the results (as lines). They make it easier to focus on substantive results.
Note: This package is designed to work with regression models created with the R package MCMCpack.
Creating a regression model
Let's begin by creating some data for the regression model. Normally you would have a dataset to analyse, but this doesn't travel well on websites. We just create a bunch of random variables for illustration.
set.seed(1984)

x=runif(100)

y=runif(100)

z=y+runif(100)

w=y+runif(100)

g=c(rep("M",50), rep("F",50))

d=data.frame(x,y,z,w,g)
Then we run a couple of regression models in MCMCpack. We run a plain model (m1), one with categorical variables (m2), and one with an interaction term (m3).
library(MCMCpack)

m1=MCMCregress(y~x+z+w, data=d)

m2=MCMCregress(y~x+z+g, data=d)

m3=MCMCregress(y~x+z*w, data=d)
Creating a coefficient table
There's a function to create a simple table with just the coefficients and quantiles to indicate the uncertainty of the estimates.
ctable(m1)
   Mean  2.5% 97.5%

x -0.08 -0.20  0.03

z  0.37  0.29  0.45

w  0.29  0.20  0.39
Specific names can be added, and the whole thing works with the kable function in library knitr, if desired.
ctable(m1, names=c("Xenon", "Zirconium", "Wolfram"))
           Mean  2.5% 97.5%

Xenon     -0.08 -0.20  0.03

Zirconium  0.37  0.29  0.45

Wolfram    0.29  0.20  0.39
Creating a plot
For a basic coefficient plot, you can use the function cplot.
cplot(m1)
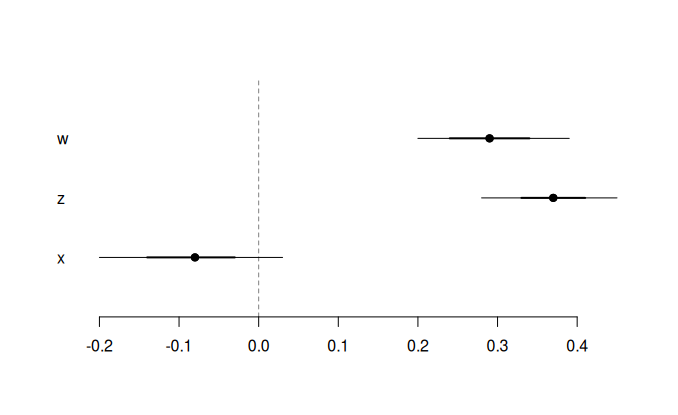
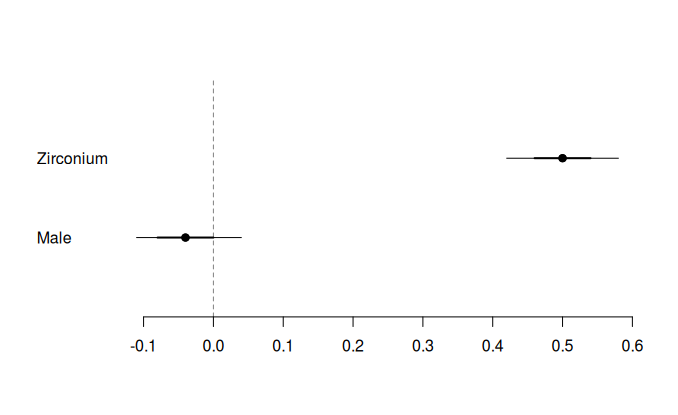
The plot can use just some of the variables and use names as provided rather than the variables names in the dataset. They can be customized as normal (base) R plots, and work with library basetheme if desired.
cplot(m2, vars=c("gM", "z"), names=c("Male", "Zirconium"))
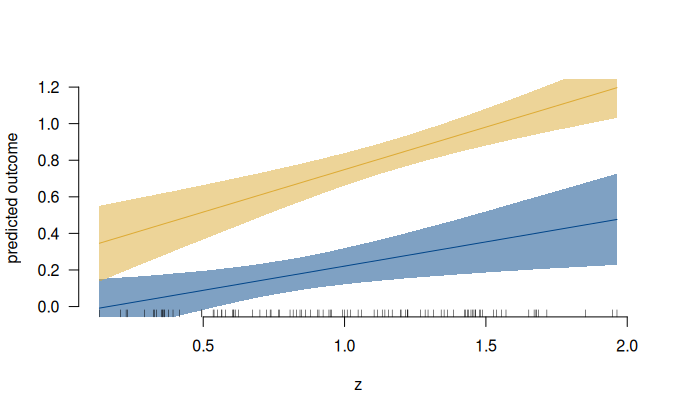
Interaction plot
To better understand interaction terms, we can plot them using iplot. A focal and fixed variable need to be specified. By default, the lines are drawn at the minimum and maximum of the fixed variable. By default a rug plot is included to show the values at which there are observations in the data.
iplot(m3, focal="z", fixed="w")
Please refer to the help for more details on all the functions.
Last update 24 September 2025